Modelling of insulin response to glucose uptake
Computational modelling of insulin response to glucose uptake including the role of obesity
- Hypothesis
Insulin response to glucose intake is modified by obesity.
- Background
On observing the OGTT data or glucose feeding pattern of obese and non-obese patients the insulin responses were found to be different. The patients were given glucose solution (75g of glucose in 200mL of water) and their blood samples were collected over 2 hours. Every 15 minutes starting from 0 (before giving glucose solution), 15, 30, 45, 60, 90, 120 various parameters were observed. A model will be developed to study the effect of obesity in insulin glucose pathway. There are theoretical reports that supports the association of insulin with adipokines(adiponectin, leptin and adipsin) whereas the biological significance of the association of glucose and adipokines are yet to be found. For now adipokines are expected to modulate IG pathway where glucose will be an independent variable and insulin will be a dependent variable. The insulin release depends on mainly four factors:
-
Glucose level
-
Insulin resistance
-
β-cell function
-
GLP-1 level

GLP-1 (Glucagon like peptide) is an incretin that stimulates β-cells of pancreas to produce insulin in a glucose dependent fashion. When glucose goes up insulin is secreted and when glucose level lowers insulin secretion is shut off. GLP-1 is secreted by epithelial cells in the gut in accordance with the glucose levels in the meals. The DPP-4 enzyme decrease insulin secretion by converting active GLP-1 to inactive GLP-1. DPP-4 inhibitors enhance peripheral glucose uptake and suppresses glucagon secretion thereby reducing hepatic glucose output leading to better glycemic control. DPP-4 inhibitors increase insulin secretion depending upon intake of food. More food intake, more of GLP-1 more insulin secretion whereas less food intake less glycemic control. It also improves health status of β-cells by protecting them from further damage.
- Factors that influence the association of insulin response and obesity Obesity can be expressed in different ways:
3.1 BMI
BMI (Body Mass Index) is the most common marker of obesity. BMI is a person’s weight in kilograms divided by the square of height in meters. BMI is an inexpensive and easy screening method with standardized cutoff points for overweight and obesity: Normal weight is a BMI between 18.5 and 24.9; overweight is a BMI between 25.0 and 29.9; obesity is a BMI of 30.0 or higher. BMI does not measure body fat directly, but BMI is moderately correlated with more direct measures of body fat. It is an indirect and imperfect measurement and does not distinguish between body fat and lean body mass.
3.2 Waist Circumference
The addition of waist circumference (WC) to body mass index (BMI; in kg/m2) predicts a greater variance in health risk than does BMI alone https://doi.org/10.1093/ajcn/79.3.379. Excessive abdominal fat may be serious because it places you at greater risk for developing obesity-related conditions, such as Type 2 Diabetes, high blood pressure, and coronary artery disease. The waistline may suggest a higher risk of developing obesity-related conditions for: a man whose waist circumference is more than 40 inches and a non-pregnant woman whose waist circumference is more than 35 inches. Waist circumference can be used as a screening tool but is not diagnostic of the body fatness or health of an individual. May be less accurate as the measurement procedure has not been standardized
3.3 Bioelectric Impedance (BIA) for fat mass
BIA equipment sends a small, imperceptible, safe electric current through the body, measuring the resistance. The current faces more resistance passing through body fat than it does passing through lean body mass and water. Equations are used to estimate body fat percentage and fat-free mass. [ Hu F. Measurements of Adiposity and Body Composition. In: Hu F, ed. Obesity Epidemiology. New York City: Oxford University Press, 2008; 53–83.]
3.4 Leptin
Serum leptin levels positively correlates with obesity. • Increases insulin sensitivity • Decreases hepatic production of glucose contributing to glucose lowering effects.
3.5 Other adipokines adiponectin, adipsin
3.5.1 Adiponectin
• Plays an important role in development of IR. Also, adiponectin levels are reduced in association with IR • Enhance insulin sensitivity through increased fatty acid secretion and inhibition of hepatic glucose production.
3.5.2 Adipsin
• Improves beta cell function • Serum adipsin level negatively correlated with IR
3.6 GLP-1
Active GLP-1 stimulates insulin secretion and suppresses glucagon secretion thereby achieving a better glycemic control.
- Goal
Our goal is to analyse and infer whether adding the above factors/ predictors make the model more accurate.
- Supporting mathematical equations
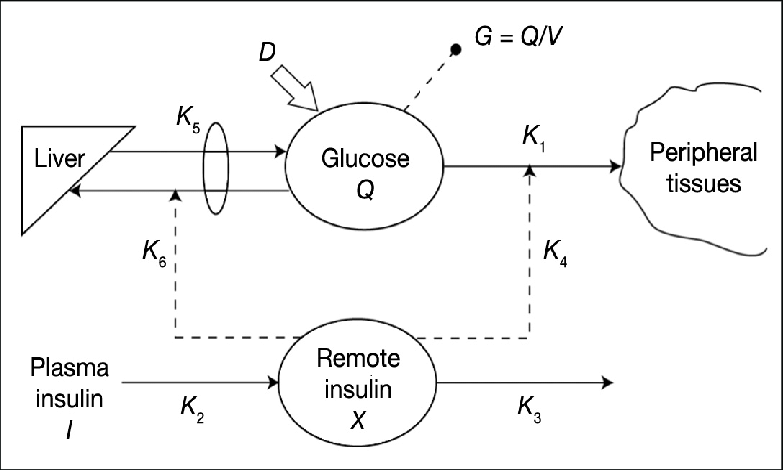
The minimal model of insulin glusose pathway is extended to include the role of adipocytes and insulin response.
\begin{align}
\frac{dG}{dt} = &\ −(b_1 + x)\cdot G + b_1 \cdot G_\text{b}- \underbrace{V_l\frac{A_l}{k_l+A_l}}{C_l}- \underbrace{V_a \frac{A_a}{k_a+A_a}}{C_a}
\frac{dx}{dt} = &\ − b_2 \cdot x + b_3(I − I_\text{b})
\frac{dI}{dt} = &\ \underbrace{V_d\frac{A_d}{k_d+A_d}}{C_d} -b_6 (I − I\text{b})+k_{GLP}GLP1(G − b_5)^{+}
\frac{dGLP1}{dt}= &\ -k_{D}D+b_7 (G − b_5)^{+}
% \HOMAS= &\ \frac{k_{IR}}{\HOMAIR} + C_a+C_l
% \HOMAB= &\ k_{\beta d}C_d
\end{align}
where $G(t)$, $I(t)$ denotes blood glucose concentration and blood insulin
concentration at time $t$, respectively.
There $x(t)$ is an auxiliary function to model the time delay in insulin-dependent glucose
uptake activity.
$G(0) = b_0$, $x(0) = 0$, $I(0) = b_7 +I_\text{b},(G−b_5)^{+} = (G−b_5)$,
if $G > b_5$, $0$ otherwise.
$G_\text{b}$ is the baseline glycemia and $I_\text{b}$ is baseline insulemia of the subject;
$b_1,\ldots,b_6$ are various rate constants, and $b_0, b_7$ are constants.
In eqn 1 there are two additional terms $C_l$ and $C_a$ representing the action of leptin and adiponectin in lowering blood glucose level by reducing hepatic glucose production. In egn 3 the term $C_d$ corresponds to increase in concentration of insulin as adipsin enhances beta cell function. $k_{GLP}$ is the rate constant for concentration of active GLP1. Eqn 4 represents the rate of change of active GLP-1. It is directly correlated to DPP-4 inhibitors(if any intake). Also active GLP-1 depends on the amount of glucose intake.